Dolby Calibration
A mobile hearing health app that tests hearing at six frequencies, calibrates Dolby-enabled headphones to the user's hearing profile, and provides personalized audio health guidance.
Year
2024
Duration
4 Months
Role
UX/UI Designer
Team
5 Members
Skills
01
Overview
Dolby sponsored this university project to explore how a mobile app could help users understand their hearing health and calibrate their Dolby-enabled audio devices to their individual hearing profile. Our team of five ran user research, competitive analysis, and iterative design to produce a fully interactive prototype.
The Problem
Existing hearing apps are clinical, hard to access, and don't connect results to any actionable output like headphone calibration.
The Solution
A mobile app with an animated six-frequency hearing test that calibrates Dolby-enabled headphones and provides personalized health guidance.
17
User interviews conducted
10+
Competitor apps analyzed
6
Frequencies tested per ear
02
What We Learned
Comparative Analysis
We audited 10+ products across three categories: Dolby's own resources (AirPods), App Store hearing tests, and desktop tests. Each was evaluated on strengths, weaknesses, methodology, and reviews to surface gaps in personalization, calibration, and engagement.
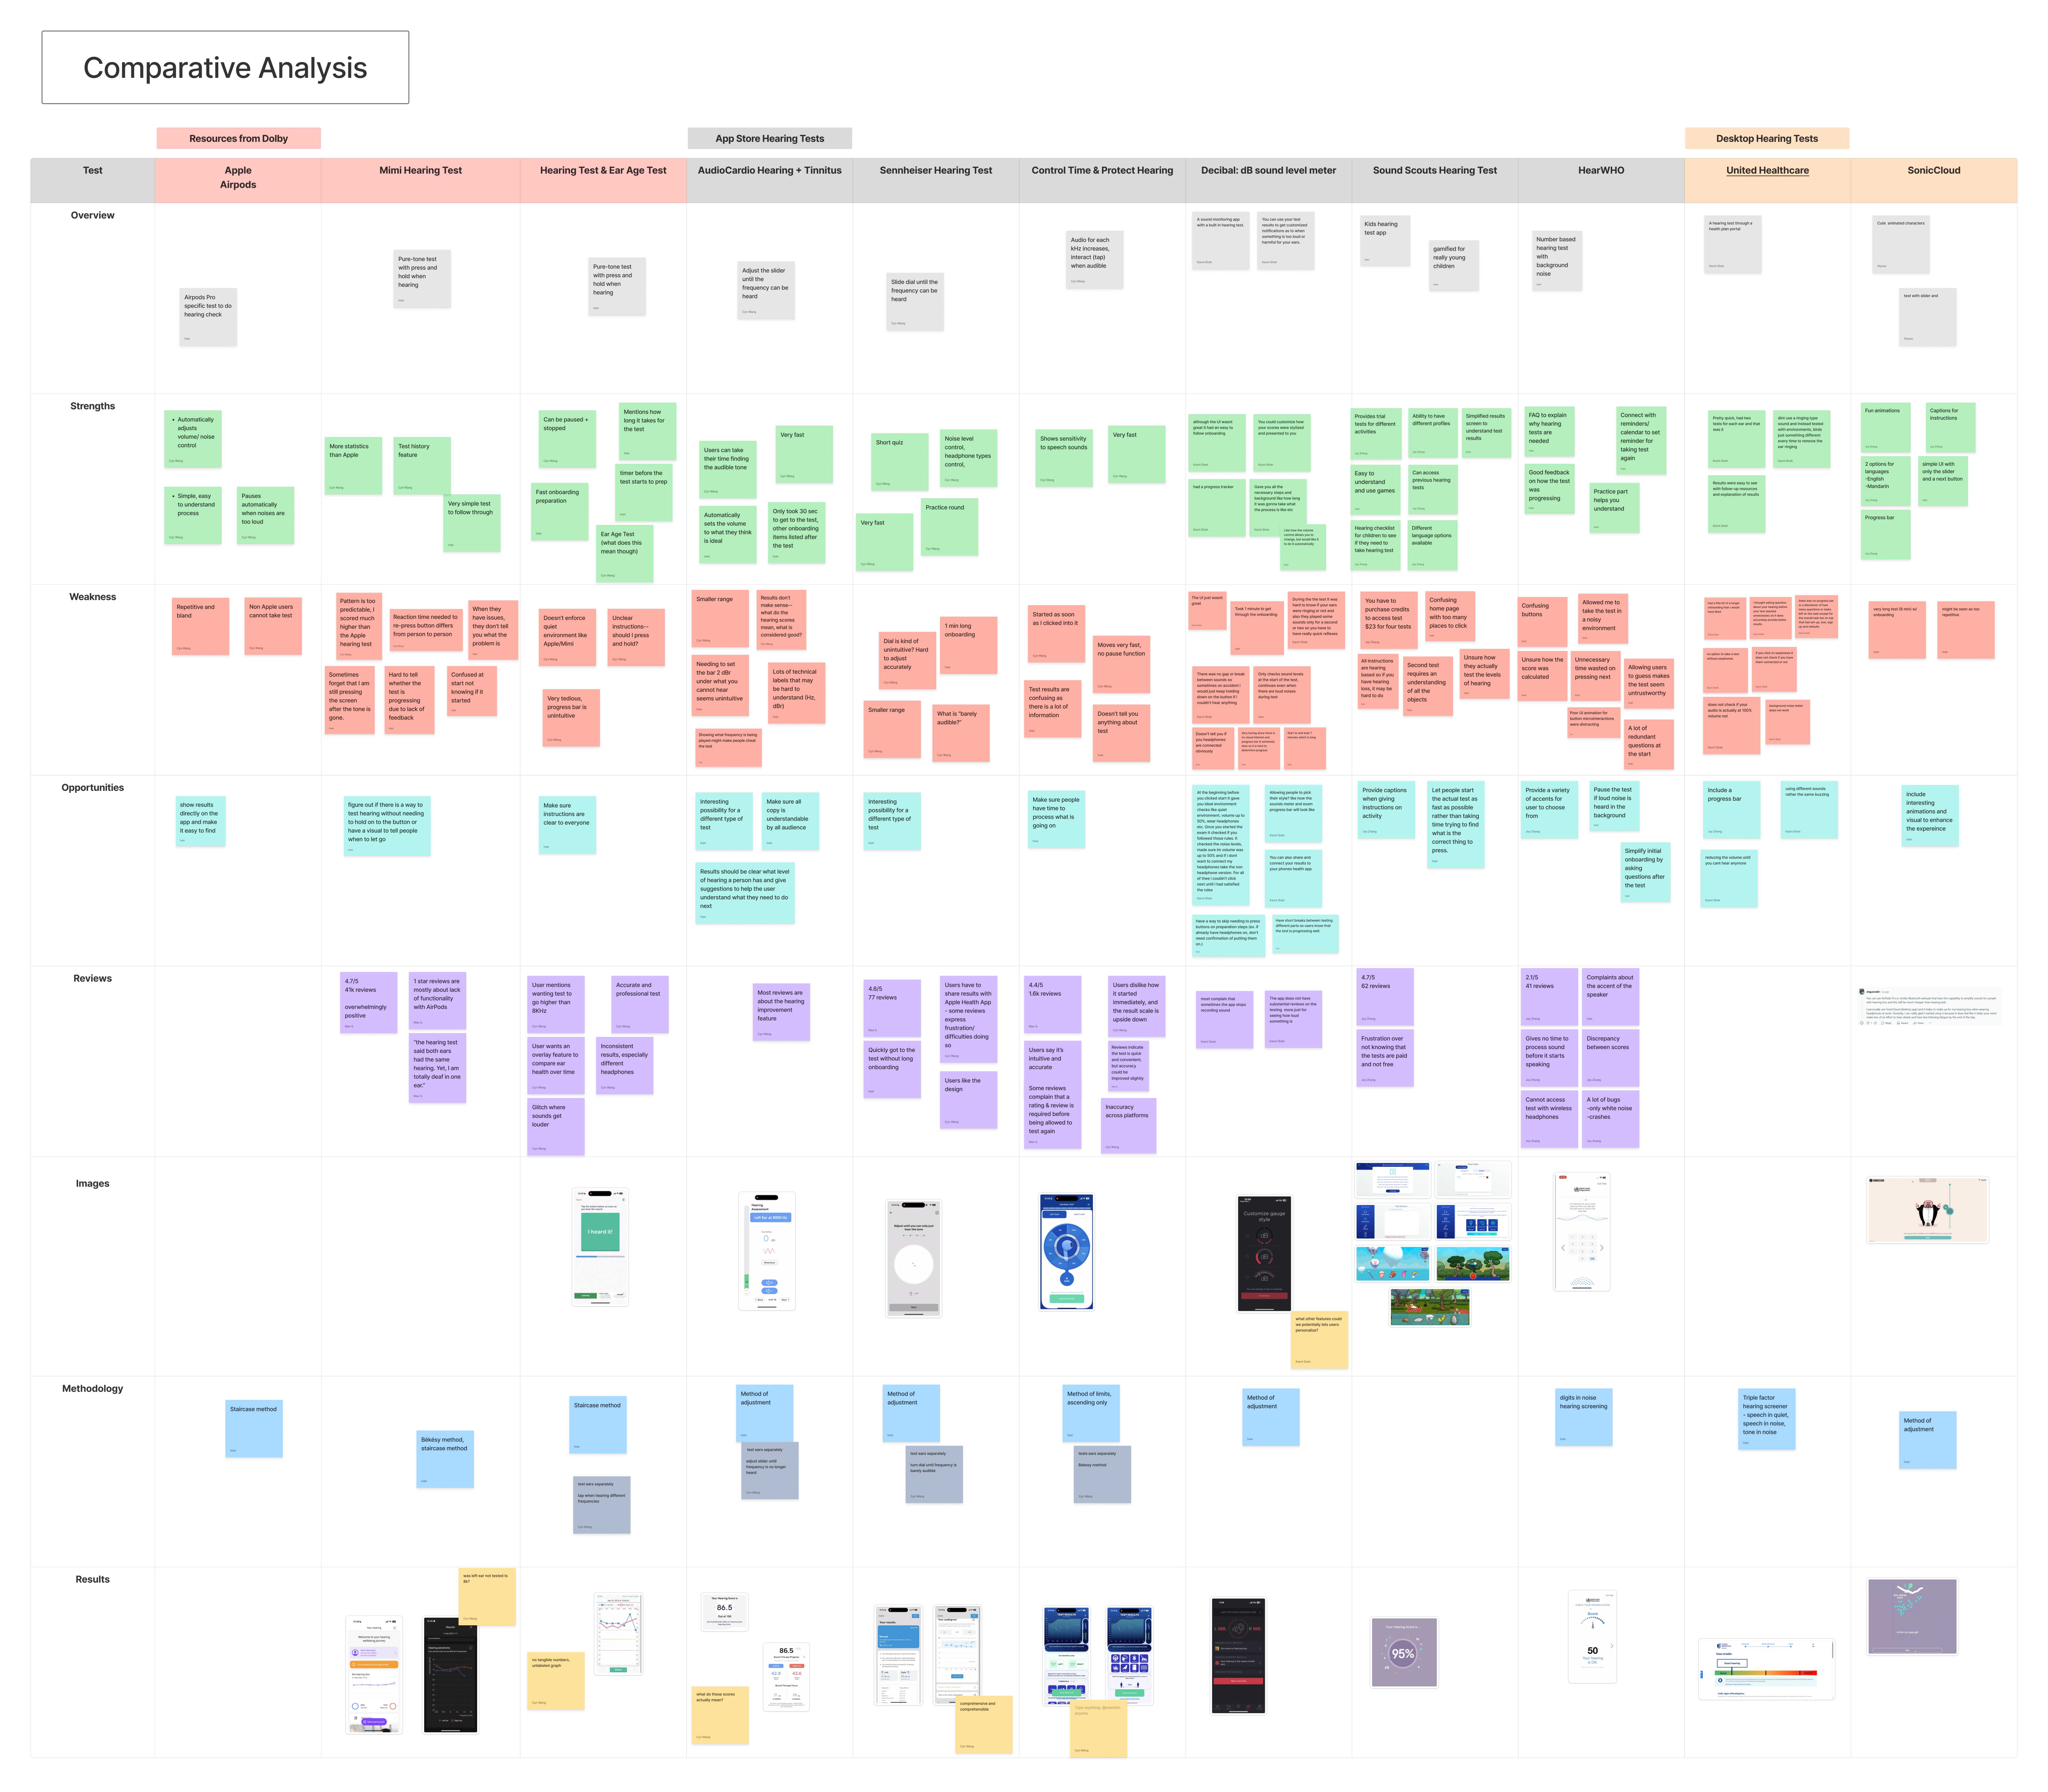
Comparative analysis — 10+ products evaluated across strengths, weaknesses, opportunities, methodology, and reviews
User Interviews & Affinity Diagram
We ran 17 user interviews and clustered findings into three theme rows: listening habits, attitudes toward hearing tests, and health app usage. The affinity diagram maps these across sub-themes including motivations for testing, perceptions of hearing loss, and privacy concerns.
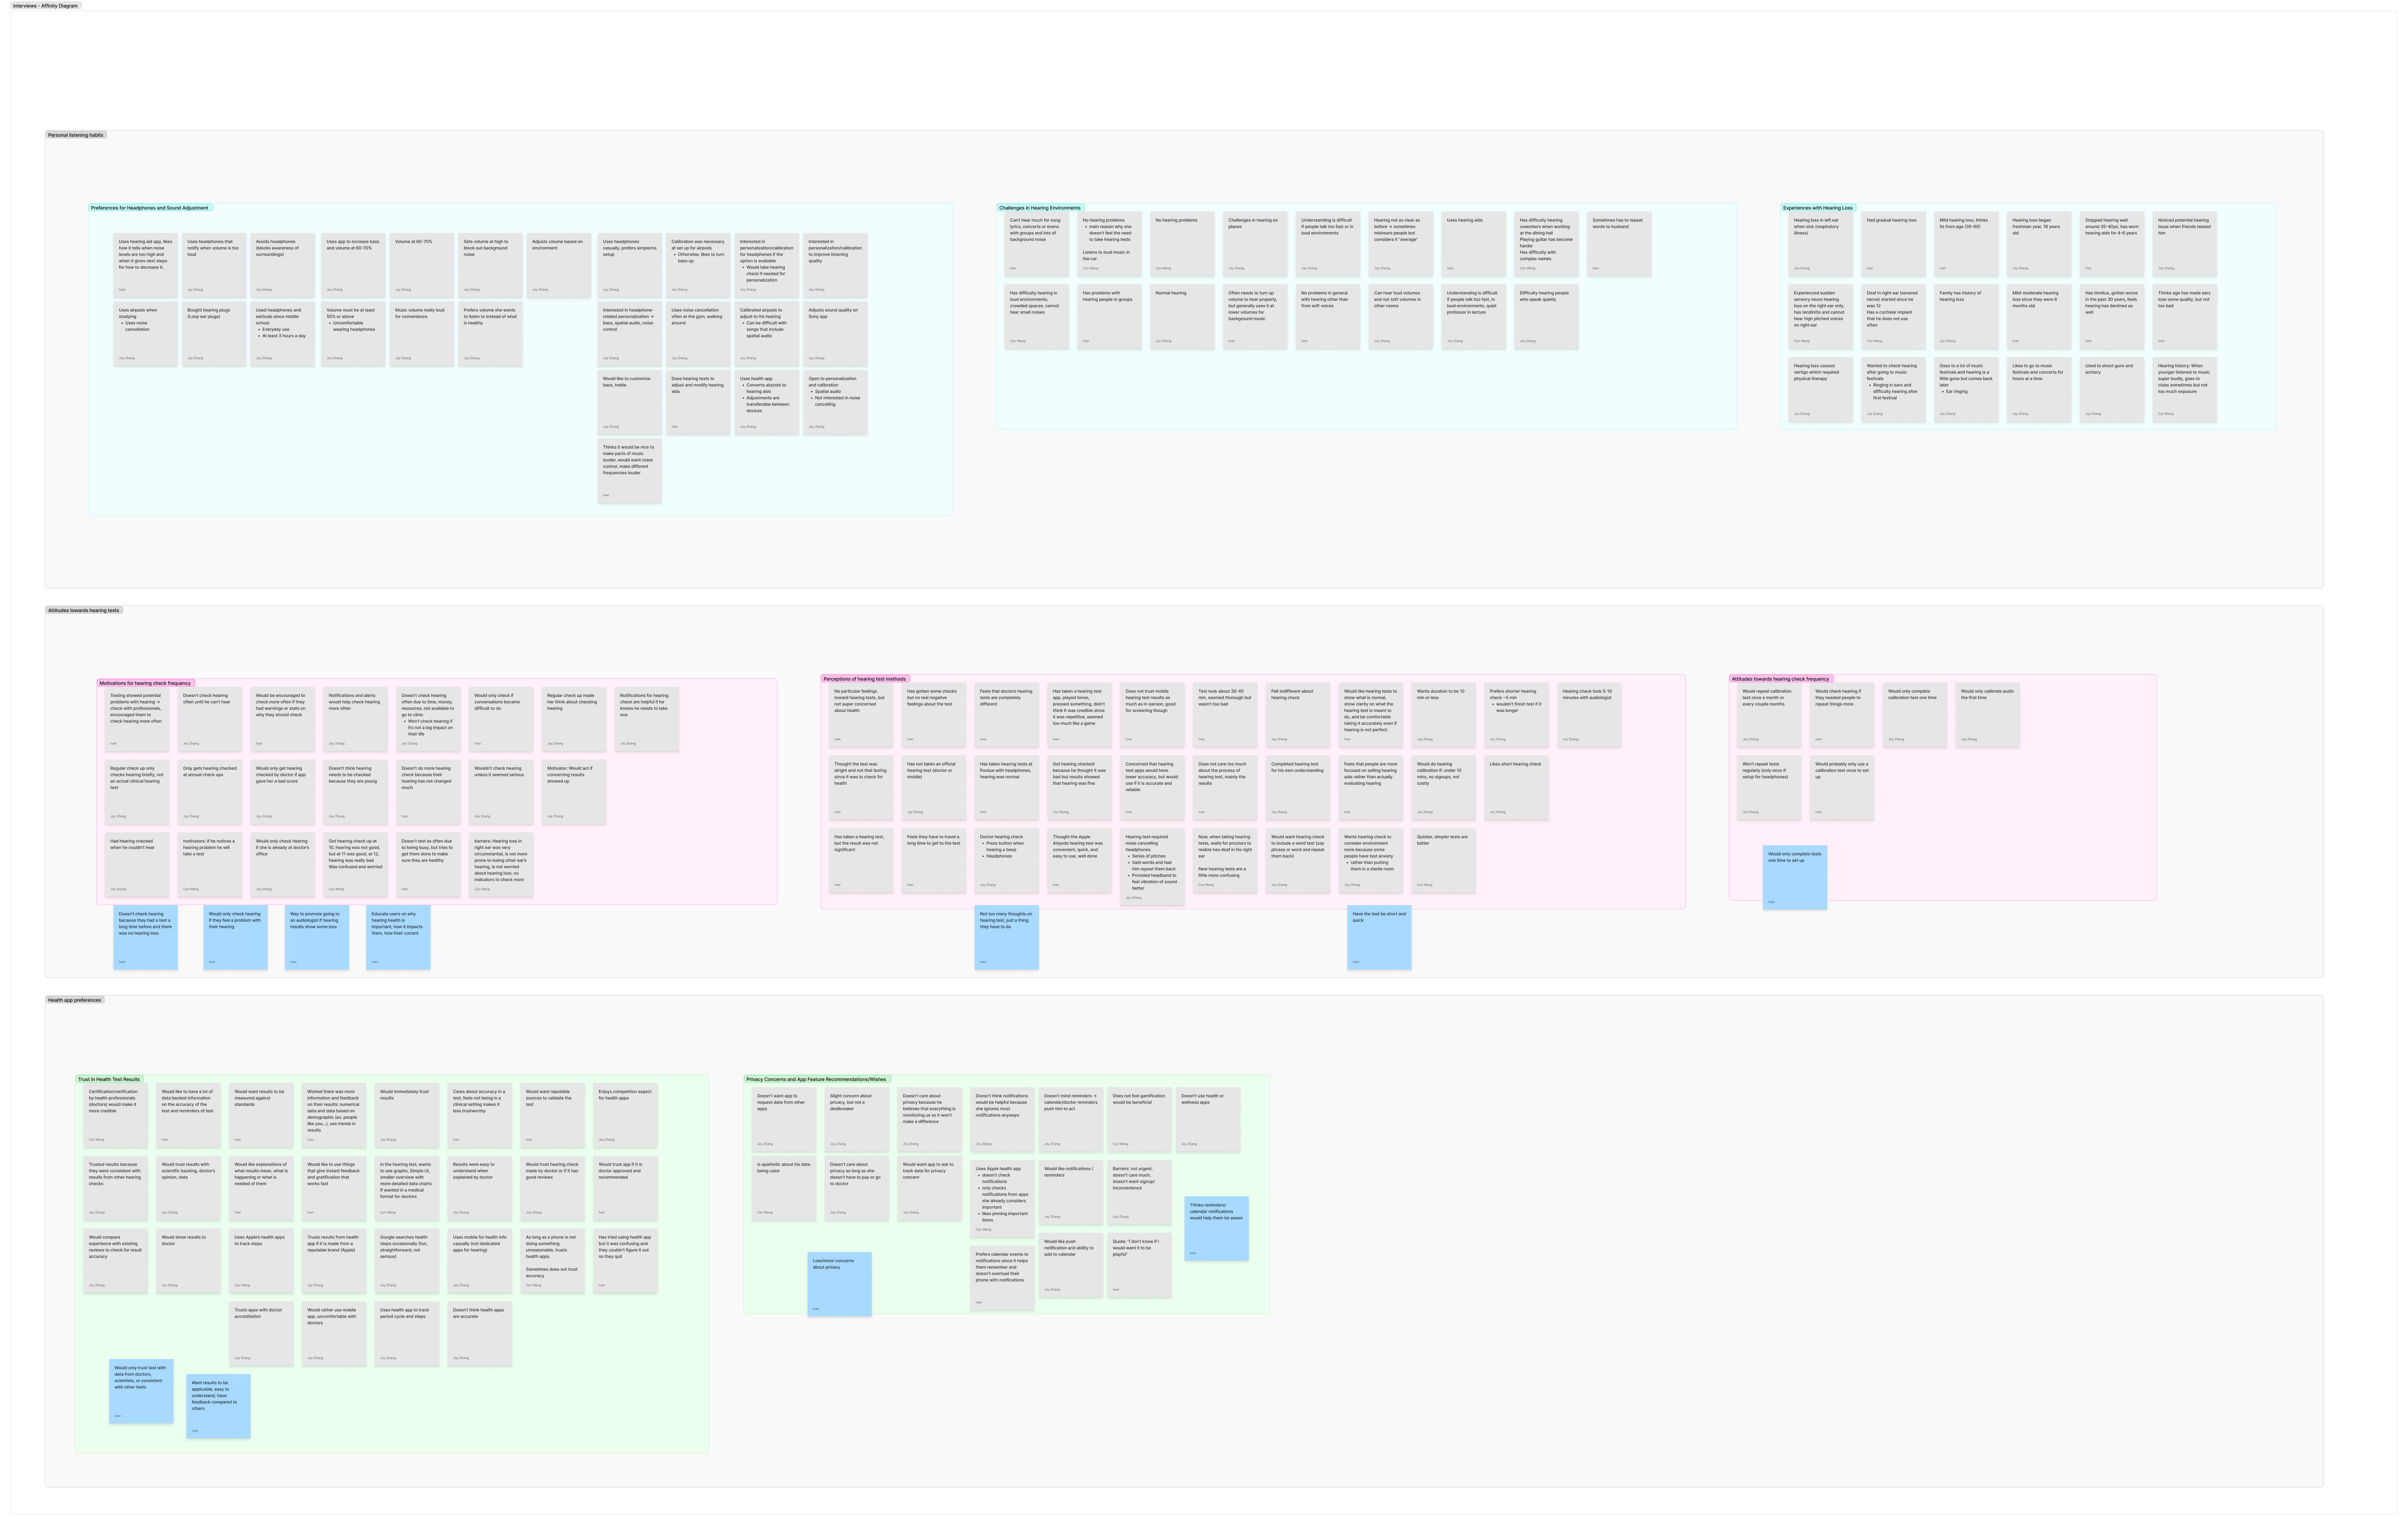
Affinity diagram — insights clustered from 17 user interviews across three main theme rows
Key Insights
Users skip onboarding when it feels like friction. Immediate test access matters.
Results feel meaningless without a follow-up action like calibration, advice, or a referral.
Demographic data collection must be clearly optional and benefit-driven.
Clinical-feeling tests see higher drop-off. Interactive visuals improve task completion.
03
Finding the Right Interaction
The core challenge was making the hearing test feel engaging rather than clinical. We explored two directions for how users would interact with audio tones, then ran preference testing.
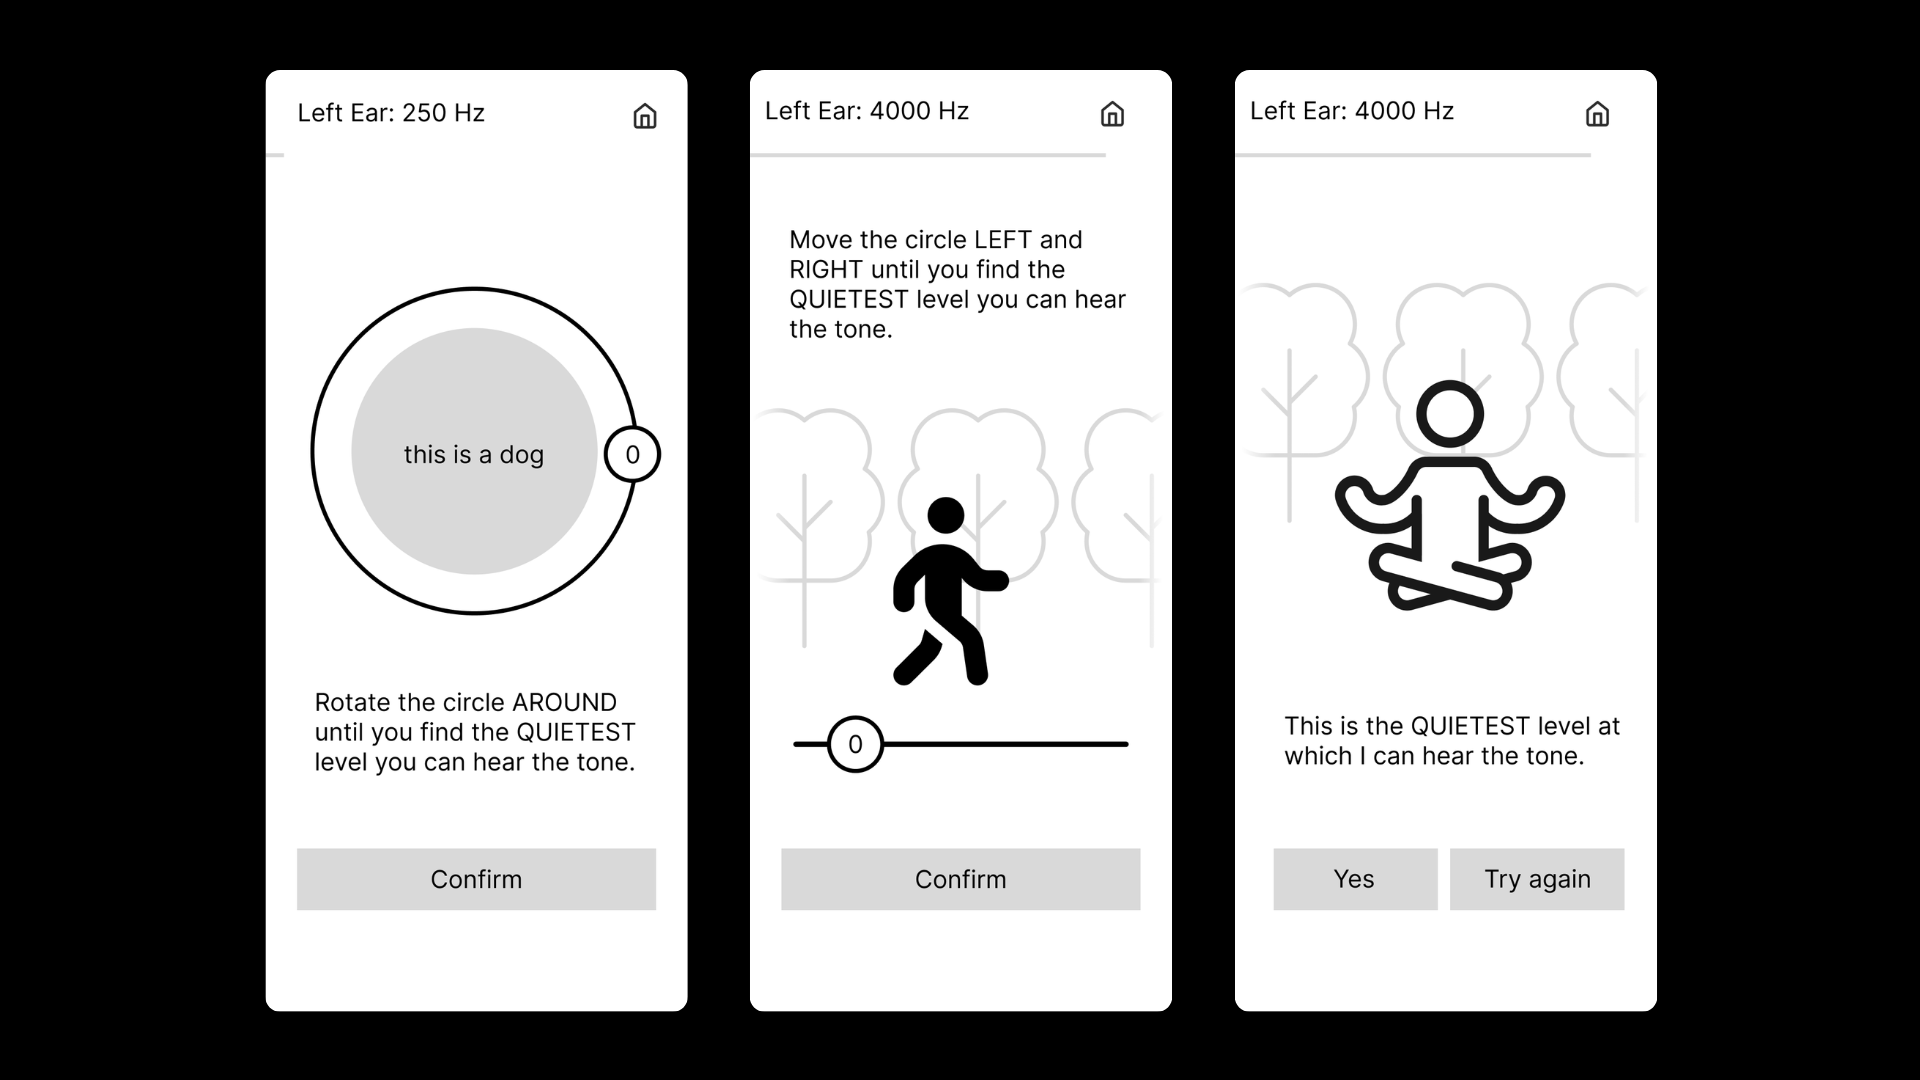
Concept A — Storytelling
Illustrated scenes with a character and environment. Users rotate a dial or move a slider to find the quietest audible tone. Each frequency has a unique scenario.
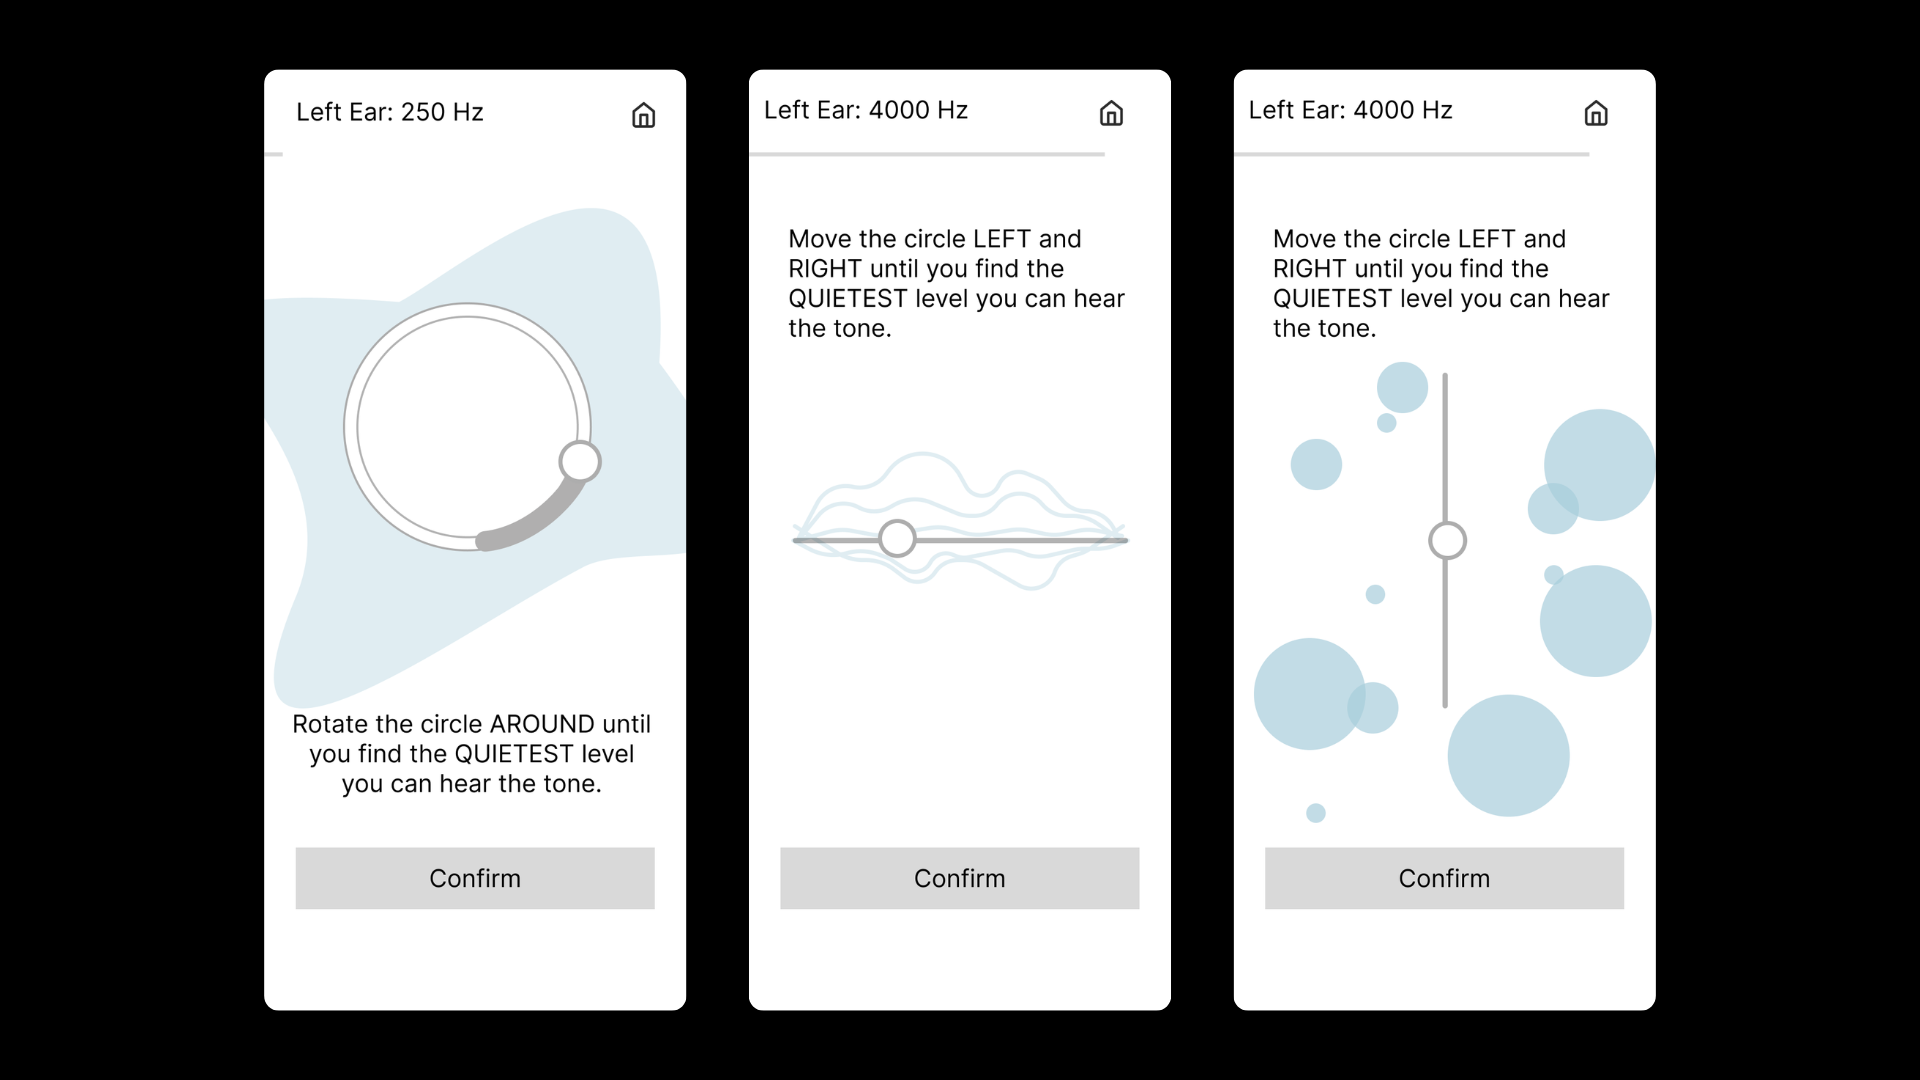
Concept B — Abstract Visuals
Minimal shapes responding to audio level. A rotating circle, waveform slider, and bubble scatter represent each frequency without narrative.
Decision
Users preferred Concept A. It felt more engaging and less clinical. We moved forward with illustrated characters, using a different scene per frequency to keep the test feeling fresh.
04
Mapping the Flow
We wireframed the core flows before committing to visual design, focusing on screen sequencing and the balance between immediate test access and optional sign-up.
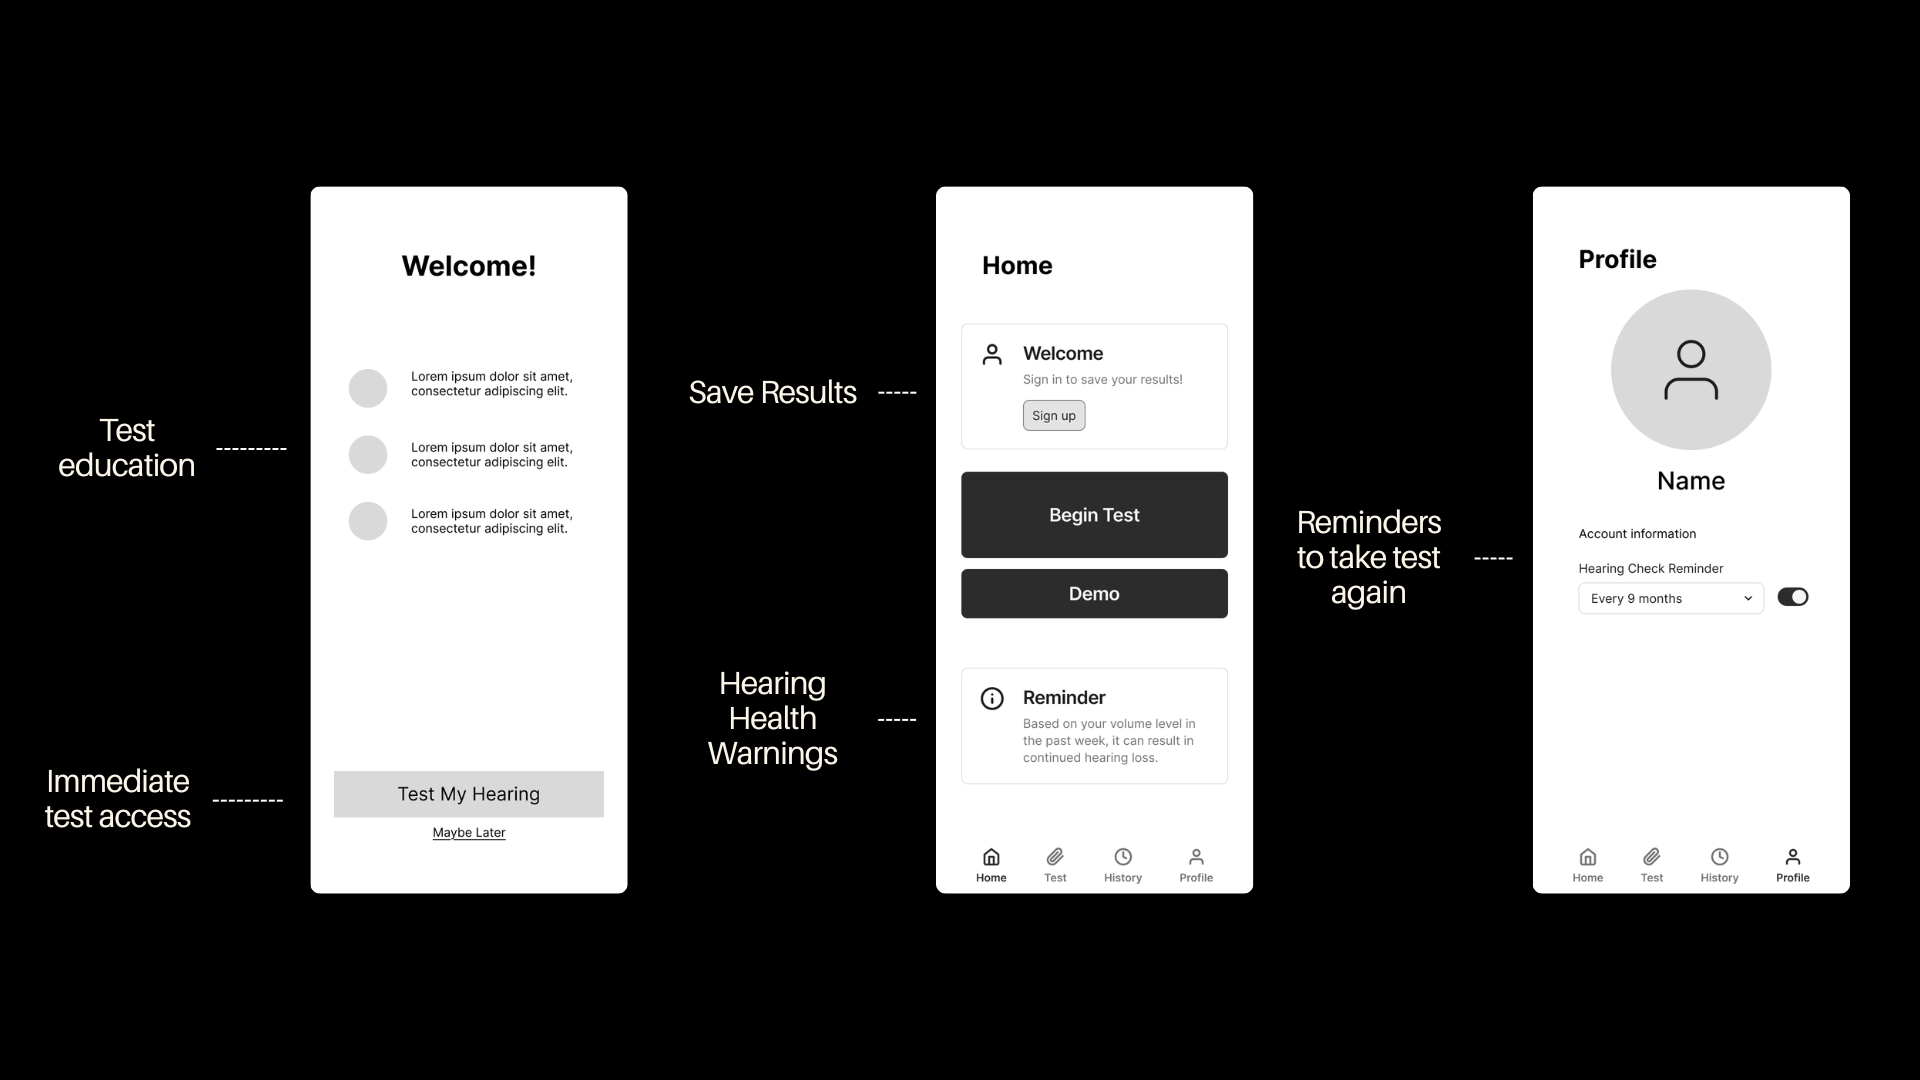
Home flow — Welcome, Home, and Profile screens

Results flow — Personalize results, Audiogram, and Calibration
05
Testing with Real Audio
To validate beyond static prototypes, we used Claude to build a live testing page. It played real audio frequencies through the browser and tracked how long each user took to find their hearing threshold per frequency. Sliders, dials, and buttons all worked, giving us behavioral data that Figma alone could not provide.
What the testing page included
Live frequencies
6 real tones (250 Hz to 8 kHz) via the Web Audio API
Time tracking
Duration per frequency recorded to surface hesitation patterns
Real interactions
Sliders, rotary dials, and buttons fully functional — not simulated
How each interaction performed
Slider
Tap When Heard
Press & Hold
Based on preference testing and behavioral time-tracking data collected via the live testing page.
06
Who We Designed For
Based on our 17 interviews, we synthesized a primary persona to keep our design decisions grounded in real user needs and behaviors.

Mark
Age 28 · Music Producer · Chicago, IL
Goals
- Understand how his listening habits affect his hearing over time
- Get the best audio quality out of his headphones without manual EQ
- Quick, easy access to a hearing check — no doctor required
Frustrations
- Existing hearing apps feel clinical and intimidating
- No app connects test results to headphone calibration
- Uncomfortable sharing health data without clear benefit
Quote
"I spend hours every day with headphones on but I've never actually checked if my hearing is okay. I just assumed it was fine."
07
The Final Experience
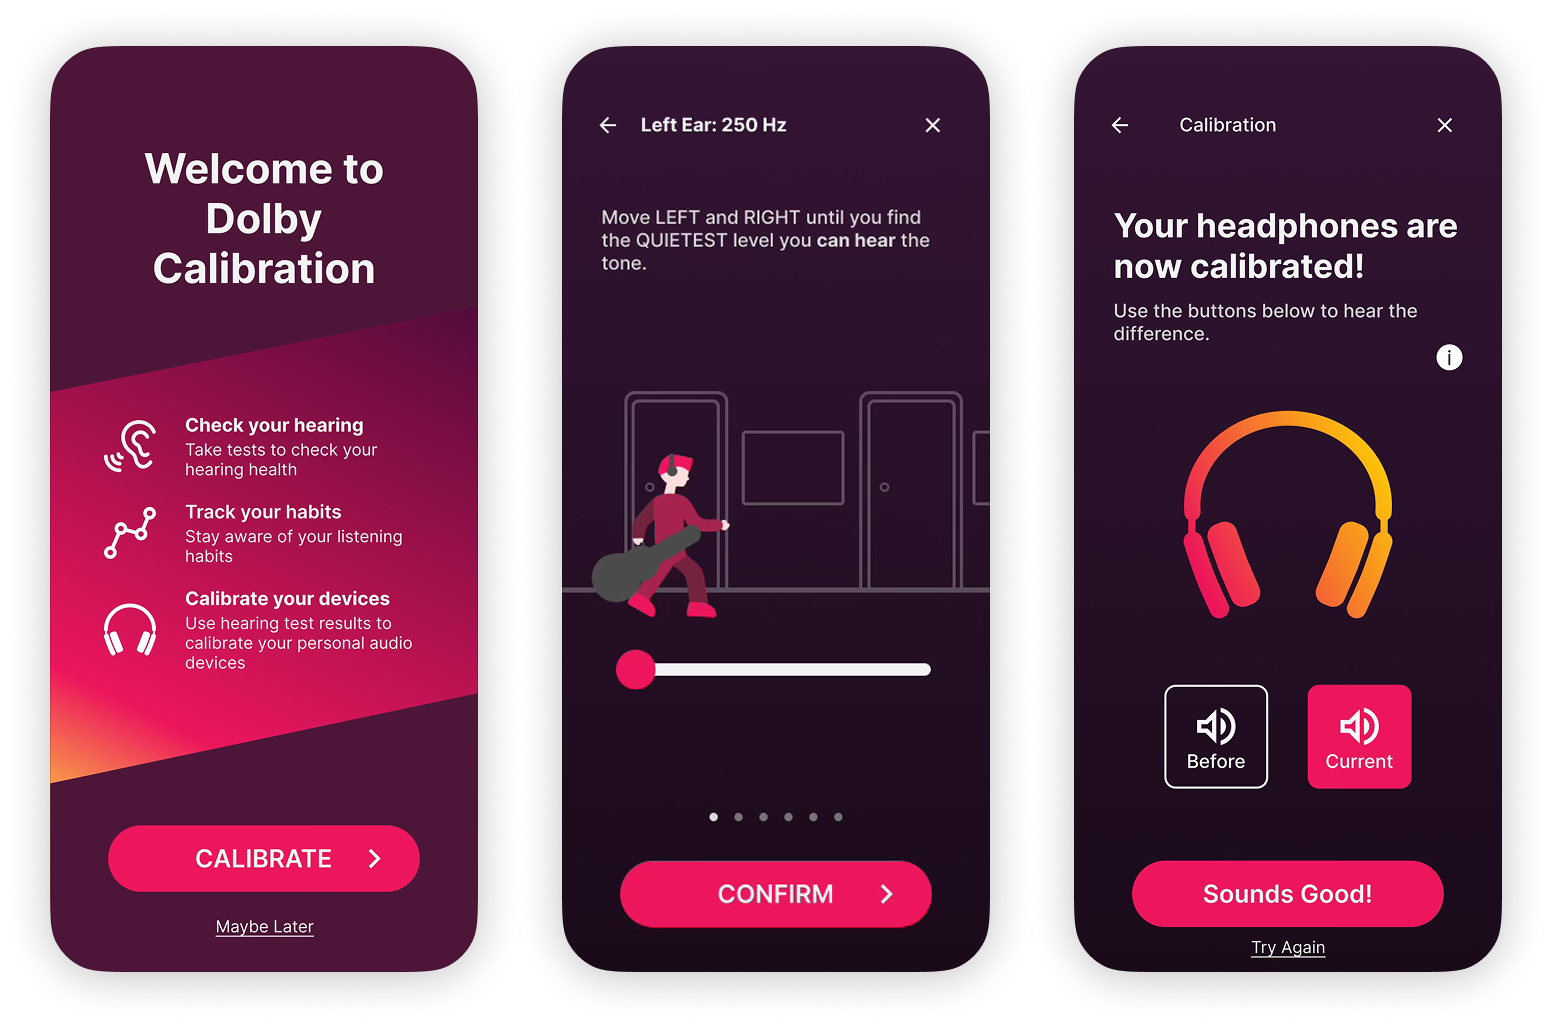
The final hi-fidelity prototype uses a dark, deep-crimson palette inspired by Dolby's brand identity, with vivid pink-red accents that guide attention. We structured the experience into three flows: Onboarding, Testing, and Offboarding.
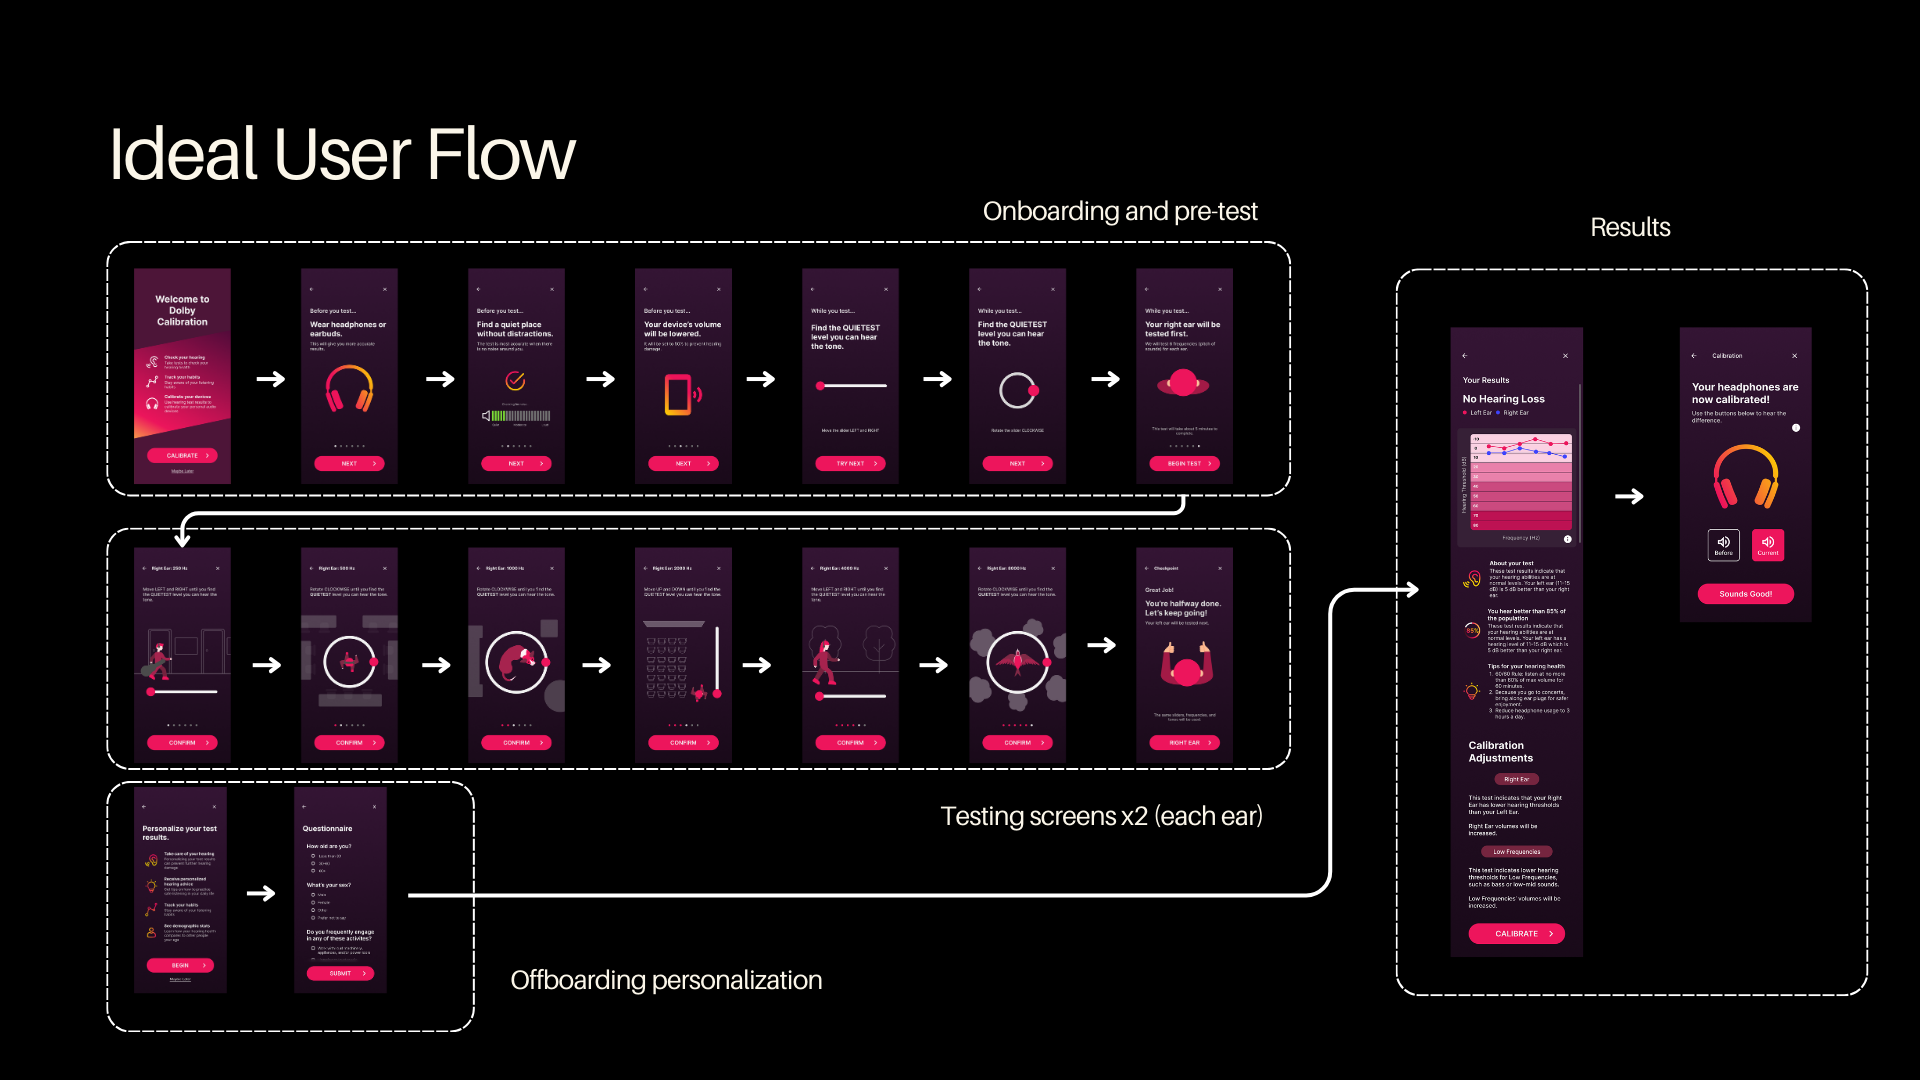
Ideal user flow — onboarding and pre-test, six-frequency testing screens, offboarding personalization and results
Onboarding
Immediate test access is the priority. The welcome screen leads with three value props: check hearing, track habits, calibrate devices. Sign-up is available but never required before taking the test.
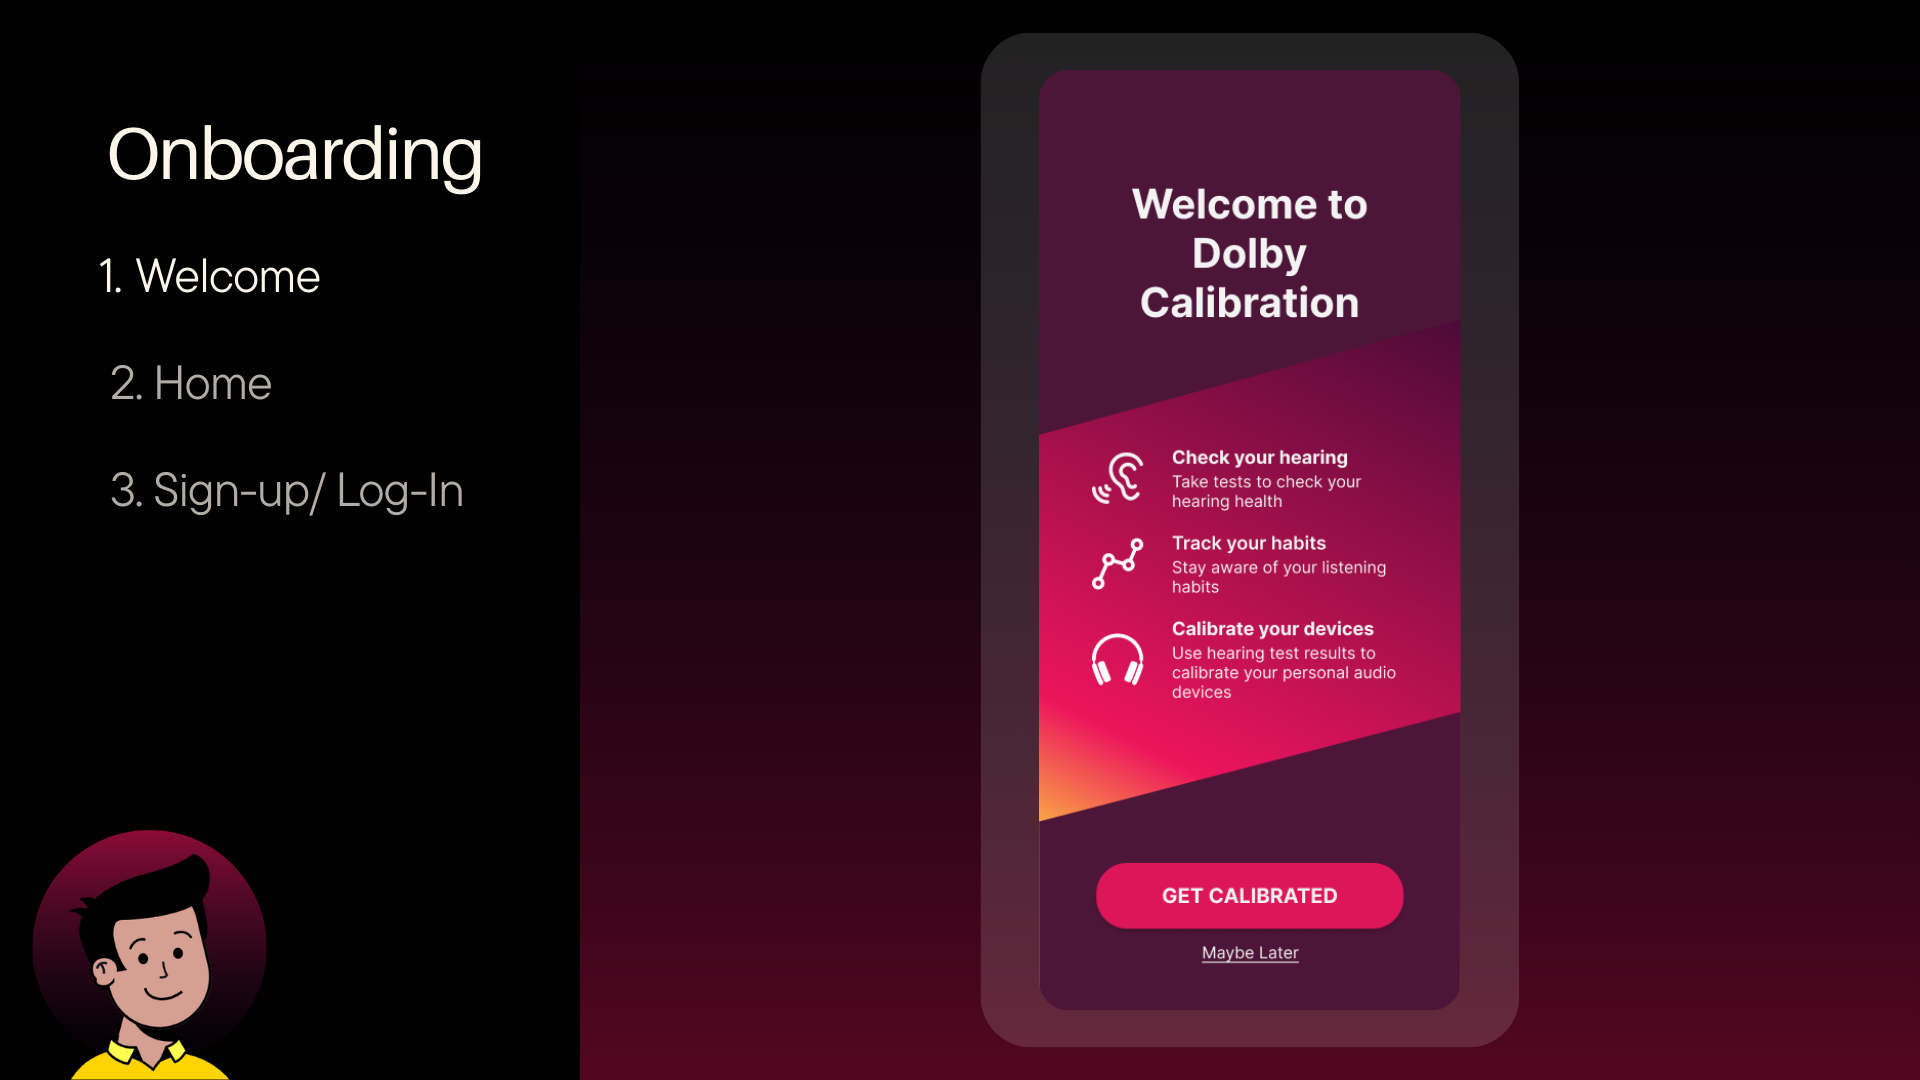
Welcome — Dolby Calibration splash with feature overview
Testing
Users are guided through a quiet-environment check and a short demo before the test starts. Each of the six frequencies gets a unique animated scene where users adjust a slider or dial to find the quietest audible tone, then confirm. Different character animations per frequency keep the experience fresh across all twelve screens.
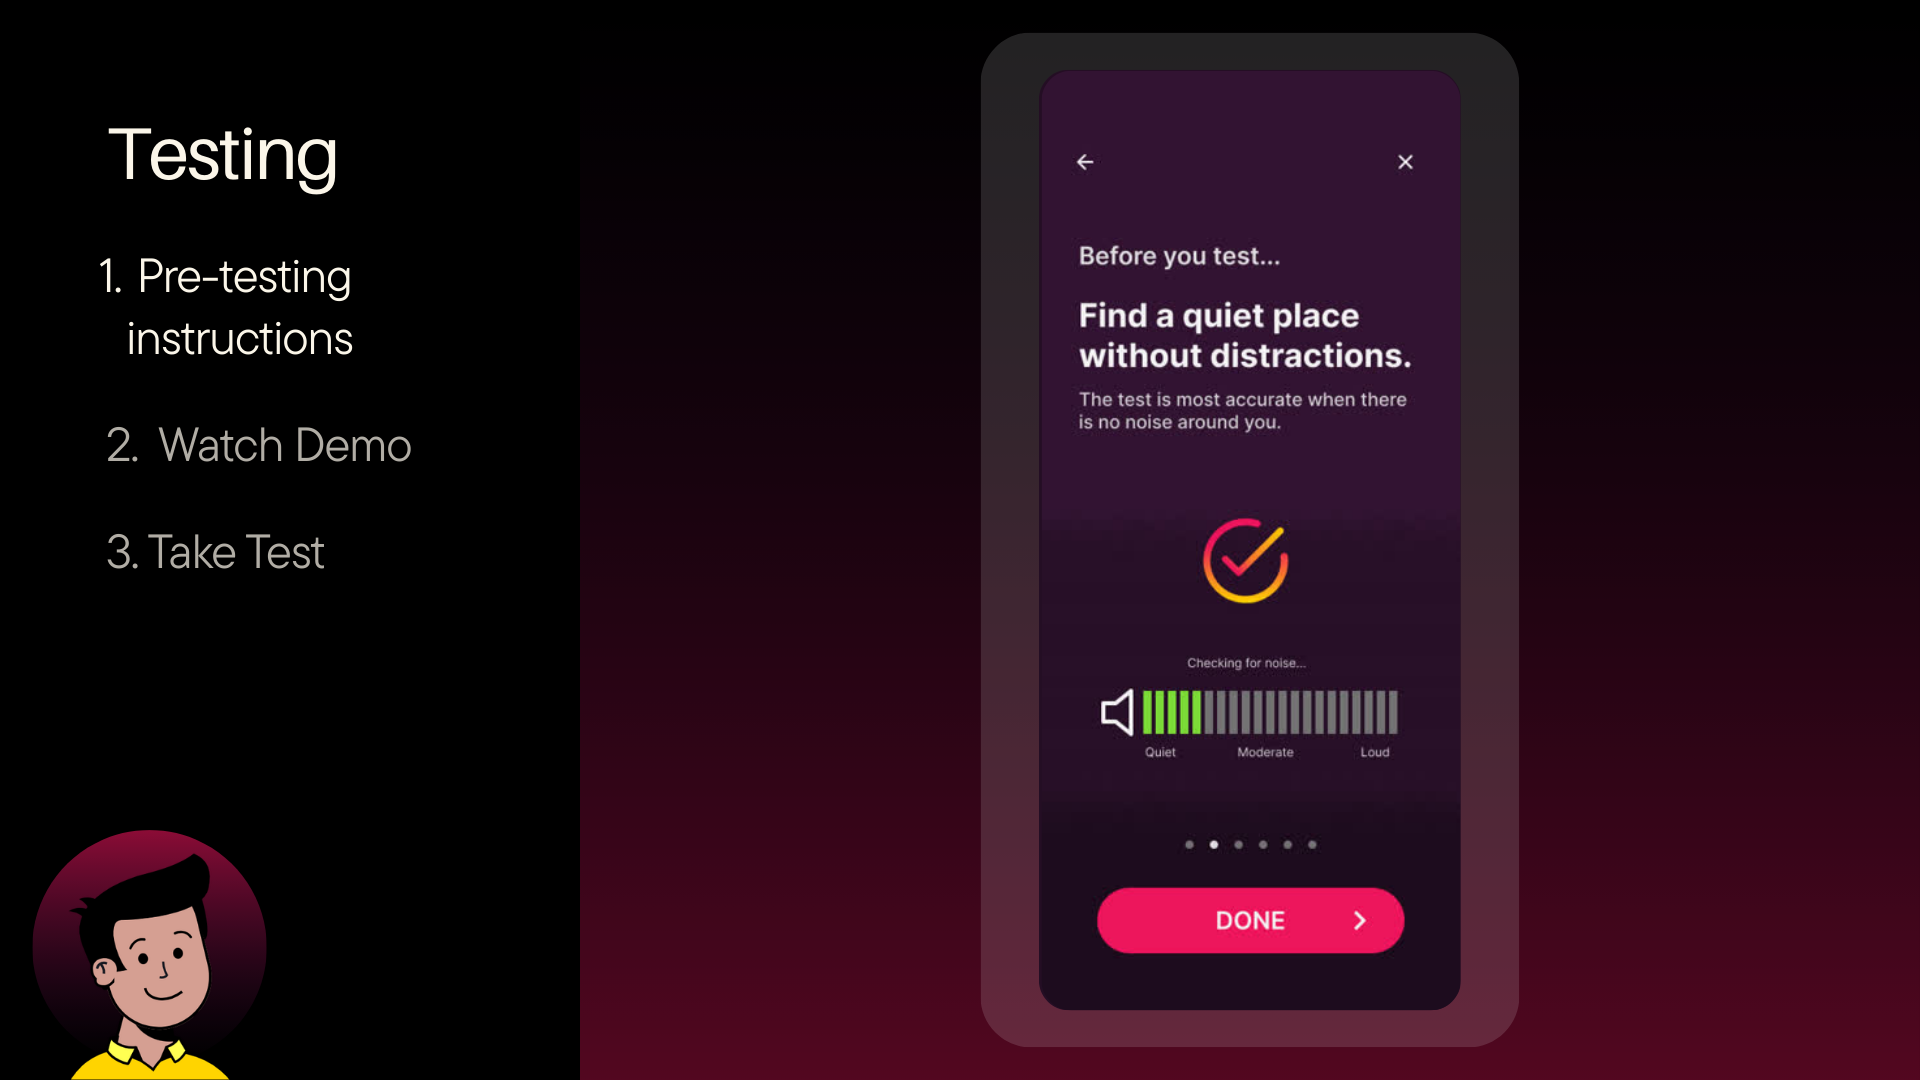
Pre-testing instructions — find a quiet place, noise check
Offboarding & Results
After both ears are tested, users can optionally fill out a short questionnaire to personalize results. The results screen shows an audiogram with left and right ear thresholds, plain-English interpretation, and a population comparison. The calibration screen then applies that data to adjust the headphone EQ, with a before/after comparison.

Personalize your results — benefits screen + demographic questionnaire
Micro-interactions & Animations
Each frequency has a distinct animated metaphor: a rat on a rotating circle, a person walking with a slider, a bird on a spinning dial. The app also includes contextual pop-ups for engagement checkpoints and volume warnings.
08
Outcomes
Our final prototype was presented to Dolby stakeholders at the end of the semester. Feedback highlighted the clarity of the test flow, the effectiveness of the storytelling interaction concept, and the value of connecting hearing test data directly to headphone calibration — a feature gap we identified in every existing competitor app.
Delivered a fully interactive hi-fidelity prototype covering all three flows: onboarding, testing, and offboarding
Validated the storytelling interaction concept through user preference testing — selected over abstract visuals
Built a functional Claude-powered testing page with real audio, live interactions, and time-tracking data
Identified headphone calibration as the primary differentiator — no existing competitor connects test results to device output
Learn More
Project Presentation
View the full final presentation for a deeper look at our research, design decisions, and prototype walkthrough.
Final PresentationNext Journey
Explore More Journeys→